ICSE Class 10 Histogram and Ogive — Mock Test (2027)
Free online mock test for Histogram and Ogive (ICSE Class 10 Mathematics) — 20 competency-based questions based on the latest CISCE 2027 syllabus, with instant marking. Try the samples below, then take the full test free.
What to expect: This mock test covers key concepts from the Histogram and Ogive chapter — including application-based and competency-focused questions aligned with how ICSE actually sets the paper.
Tip: Attempt without notes first to identify gaps, then review explanations for any wrong answers. Retake after a few days for best retention.
Sample questions
-
1.Draw a histogram from the following frequency distribution and determine the mode from the graph.
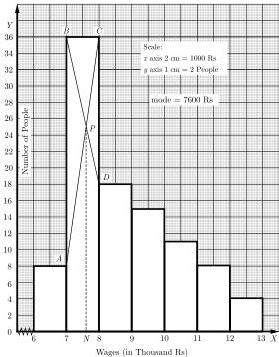
What is the mode of the given distribution?Class 20-25 25-30 30-35 35-40 40-45 45-50 Frequency 3 10 36 28 15 12 - A.₹35
- B.₹40
- C.₹43
- D.₹45
-
2.Marks obtained by 100 students in an examination are given below:
Draw a histogram for the given data using graph paper and determine the mode.Marks 0-10 10-20 20-30 30-40 40-50 50-60 Number of Students 5 15 20 28 20 12 - A.40
- B.44
- C.46
- D.50
-
3.The weekly observation on cost of living index in a certain city for a particular year is given in the table below. Using a histogram and the method of intersecting lines AC and BD in the highest rectangle, determine the mode of the data.
Cost of Living Index Number of Weeks 140-150 5 150-160 10 160-170 20 170-180 9 180-190 6 190-200 2 - A.160
- B.165
- C.170
- D.155
-
4.The following distribution gives the life times of washing machines of a certain company. Draw a histogram for the data using graph paper and locate the mode.
Life time (in hours) No. of washing machines 1000-1200 15 1200-1400 60 1400-1600 68 1600-1800 86 1800-2000 75 2000-2200 61 2200-2400 45 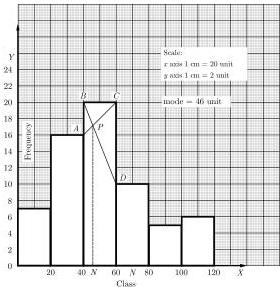
- A.1600 hours
- B.1720 hours
- C.1800 hours
- D.1900 hours
-
5.Marks obtained by 100 students in an examination are given below:
Draw a histogram for the given data using graph paper and determine the mode.Marks 0-20 20-40 40-60 60-80 80-100 100-120 Number of Students 10 15 20 28 20 7 - A.65 marks
- B.70 marks
- C.75 marks
- D.80 marks
Ready? Take the full 20-question test free — instant marking, no sign-up needed.
▶ Start free mock test